Website Load Time Benchmarks 2026: 2.5s Is the New Bar
A small business website in 2026 should render its main content in under 2.5 seconds on mobile. That is the threshold Google uses for a "good" Largest Contentful Paint, and it is the line between sites that convert and sites that bleed traffic. Yet only 48% of mobile websites pass all three Core Web Vitals, and the average page in industries like travel and retail still loads in 5–7 seconds (HTTP Archive Web Almanac, 2025; DebugBear, 2025).
This is not a vanity metric. 53% of mobile users abandon a page that takes more than three seconds, and a 1-second delay cuts conversions by roughly 7% (Think with Google, 2024). Below are the actual benchmarks for 2026, the field data behind them, and the seven fixes that move the needle most for small business sites. This is the performance chapter inside Why Your Small Business Website Loses Leads, which covers the 6 places small business sites quietly underperform.
Key Takeaways
- The "good" mobile threshold is LCP under 2.5s, INP under 200ms, CLS under 0.1 (web.dev, 2025)
- Only 48% of mobile websites pass all three Core Web Vitals in 2025, up from 44% in 2024 (HTTP Archive Web Almanac, 2025)
- The average mobile page loads main content in roughly 1.9 seconds in synthetic tests, but real-user mobile load times in travel and retail run 5–7 seconds (DebugBear, 2025)
- 53% of mobile users abandon a page that takes longer than 3 seconds to load (Think with Google, 2024)
- Every 1-second delay reduces conversions by about 7%, and a 0.1-second improvement can lift conversion rate by up to 8% (Edmonds Commerce performance research, 2025)
- LCP is the hardest metric to pass — only 62% of mobile pages clear the 2.5-second threshold (HTTP Archive Web Almanac, 2025)
How Fast Should a Small Business Website Load in 2026?
The answer most small businesses can plan around: 2.5 seconds for the main content on mobile, 200 milliseconds for tap responsiveness, and almost no visual jumping while the page paints. Anything slower and you start losing users measurably; anything faster has diminishing returns for typical small business traffic.
That comes from two distinct standards that have converged:
- Google's Core Web Vitals thresholds. A page is graded "good" when 75% of real-user visits hit LCP under 2.5s, INP under 200ms, and CLS under 0.1 (web.dev, 2025). These thresholds feed Google's page experience signal and influence rankings.
- User behavior data. 53% of mobile users abandon any page that takes longer than 3 seconds, and the bounce probability climbs steeply from there (Think with Google, 2024).
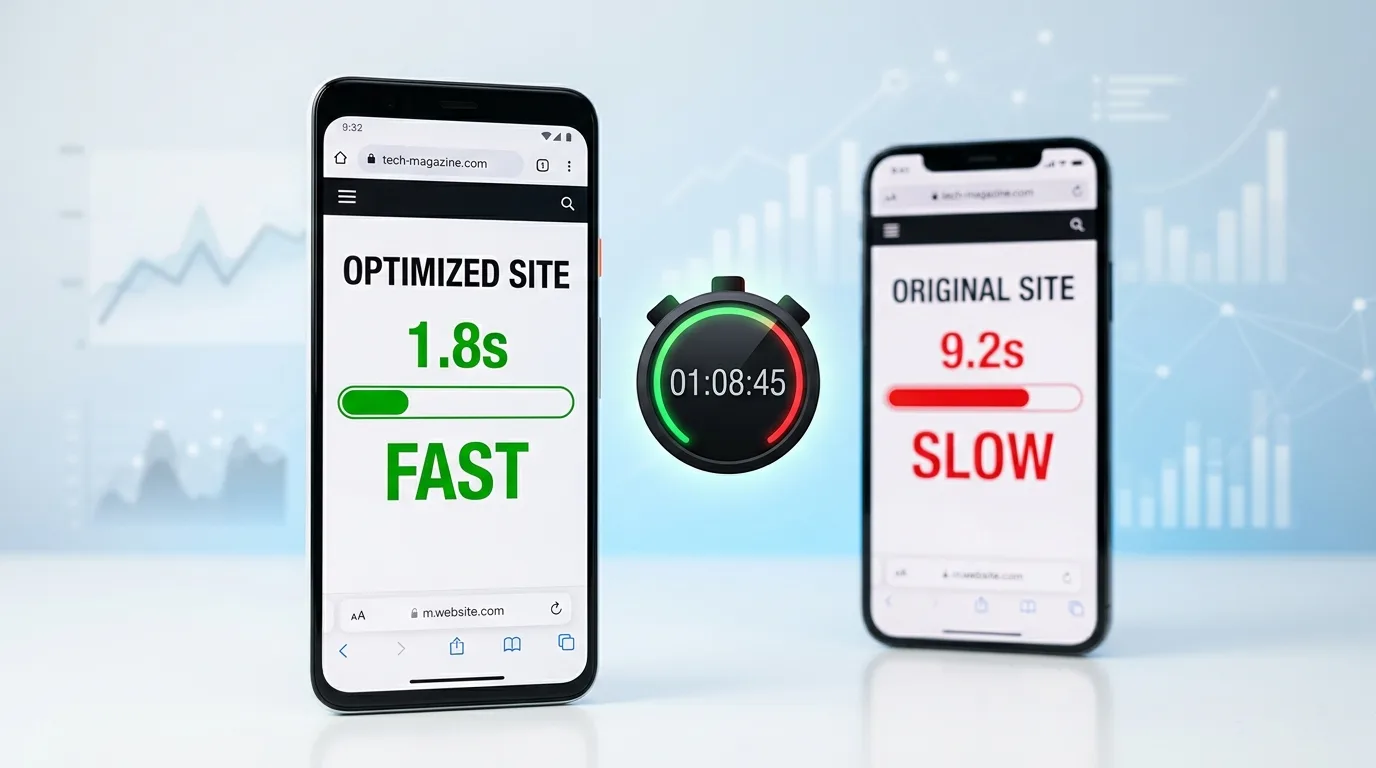
Both lines converge in the 2.5–3.0 second range. That is the band where Google's "good" threshold sits, where users start abandoning, and where small business conversions visibly drop. If your site clears 2.5 seconds, you are above the bar. If it sits at 5–7 seconds — which is the average for a typical WordPress small business site loaded over 4G — you are losing roughly half of your mobile traffic before they ever see your offer.
Desktop is more forgiving. The average top-100 desktop site loads in about 2.5 seconds, while the equivalent mobile site averages 8.6 seconds (DebugBear, 2025). The mobile gap is where most small business revenue leaks out, which is why every benchmark in this article focuses on the mobile number.
Core Web Vitals: The 2026 Thresholds in Plain English
Google grades site performance against three real-user metrics, evaluated on a 28-day rolling window of Chrome user data. The 2026 thresholds are unchanged from 2025, but the metric definitions have firmed up.
LCP — Largest Contentful Paint. How fast the main content of the page renders. For most small business sites this is a hero image, a headline block, or the first big paragraph. Under 2.5 seconds is good, 2.5–4 seconds needs improvement, over 4 is poor.
INP — Interaction to Next Paint. How fast the page responds to taps, clicks, and key presses. INP replaced First Input Delay in March 2024 and is now the harshest of the three metrics — it measures every interaction across the whole session, not just the first. Under 200 milliseconds is good.
CLS — Cumulative Layout Shift. How much the page jumps around as it loads. A 0 means nothing moved. A 0.1 means a small banner pushed content down once. CLS scores above 0.25 usually mean ads, late-loading fonts, or images without explicit dimensions are shoving content around mid-render.
The Web Almanac numbers tell you where the difficulty actually lies. 62% of mobile pages pass LCP, 77% pass INP, and 81% pass CLS (HTTP Archive Web Almanac, 2025). LCP is where most small business sites fail, almost always because of a heavy hero image or a render-blocking font.
How Page Speed Actually Affects Your Revenue
Page speed is not an abstract SEO factor — it has measurable, predictable conversion impact. The numbers below are pulled from independent studies that have held up across re-tests.
A few numbers worth committing to memory:
- A 1-second page converts at roughly 2.5x the rate of a 5-second page in mobile e-commerce (Edmonds Commerce performance research, 2025).
- Every 1-second delay reduces conversions by approximately 7%. Compounded across a typical 5-page funnel, that is a 30%+ revenue gap between fast and slow sites.
- Mobile sites that load in 5 seconds earn 2x the mobile ad revenue of sites that load in 19 seconds (Think with Google, 2024).
- A 0.1-second improvement in load time can lift conversion rate by up to 8% in retail (Deloitte Milliseconds Make Millions study, referenced 2024).
For a Cabo restaurant getting 2,000 mobile visits a month at a 3% reservation conversion rate, dragging load time from 6 seconds down to 2 seconds is the difference between roughly 60 reservations and 150 reservations a month. The work is identical; only the page speed changes.
Industry Benchmarks: How Your Sector Compares
Average mobile load times vary widely by industry. The numbers below come from Google's mobile speed research using real-user Chrome data:
| Industry | Avg. Mobile Load (seconds) | Pass Rate vs. 2.5s "Good" |
|---|---|---|
| Technology / SaaS | 6.8 | Below average |
| Travel & hospitality | 6.7 | Below average |
| Consumer packaged goods | 6.1 | Below average |
| Automotive retail | 6.0 | Below average |
| Retail (general) | 6.0 | Below average |
| Healthcare | 5.6 | Below average |
| Media | 5.5 | Below average |
| Financial services | 5.1 | Below average |
| Google "good" threshold | 2.5 | Target |
Source: Think with Google, industry mobile speed benchmarks, refreshed 2024.
The takeaway is not that 6 seconds is acceptable because everyone else is at 6 seconds. The takeaway is that the bar is so low across most industries that a small business site clearing 2.5 seconds will outrank and outconvert a competitor stuck at 6 seconds, even with worse content and fewer backlinks. Speed is one of the cleanest competitive levers a small business has.
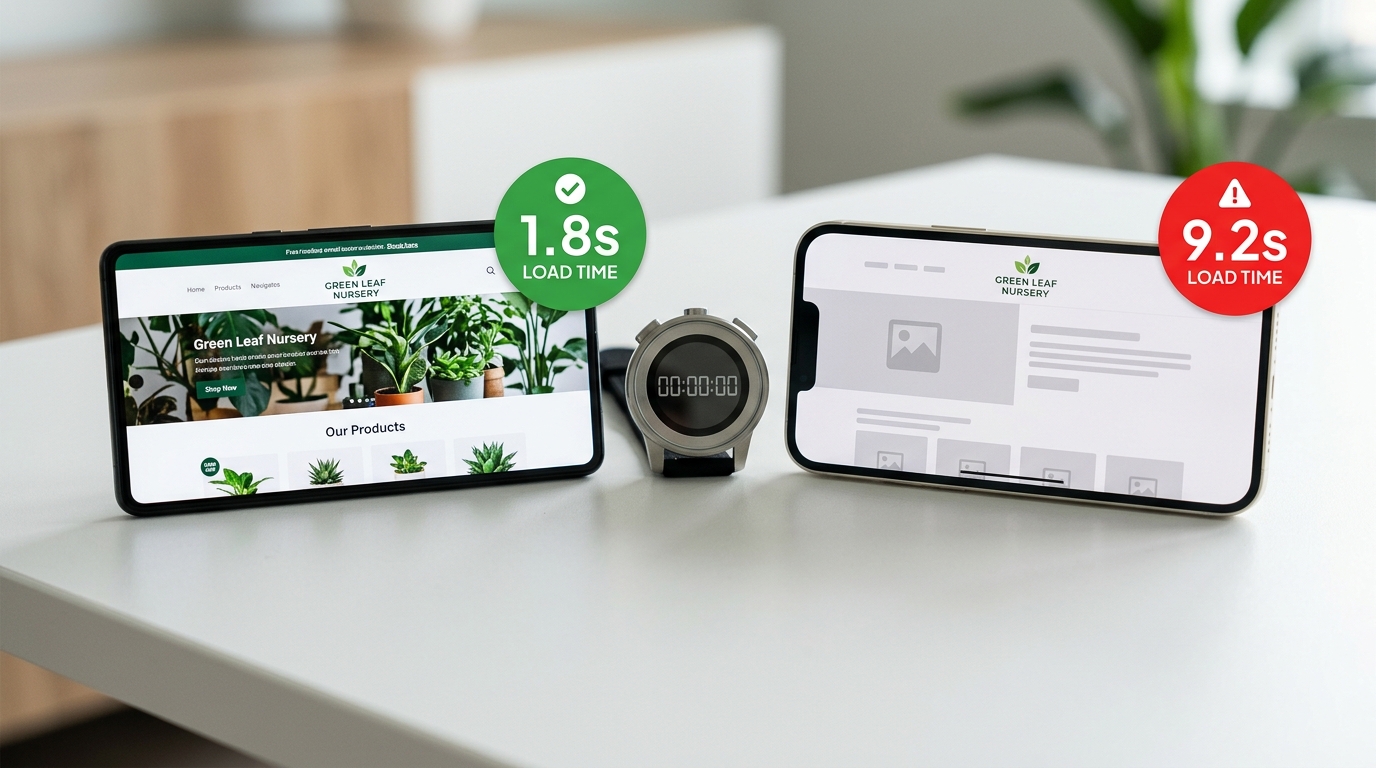
This is doubly true in markets like Los Cabos, where most local competitors are running 8–10-year-old WordPress installs with 30 plugins and zero performance work. A modern, properly built site loads in 1.5–2 seconds out of the box and shows up first in the search results that matter.
The 7 Fixes That Move the Needle Most
Pulled from a year of audits on small business sites in California and Los Cabos, ranked by impact-per-hour-of-work:
| # | Fix | Typical LCP Impact | Time to Implement |
|---|---|---|---|
| 1 | Compress and convert hero image to WebP | −3 to −5 seconds | 30 min |
| 2 | Preload the LCP image | −0.3 to −0.8 seconds | 15 min |
| 3 | Defer non-critical JavaScript | −1 to −3 seconds | 1–2 hr |
| 4 | Self-host fonts with font-display: swap |
−0.5 to −1 second | 30 min |
| 5 | Add explicit width/height to all images |
Fixes CLS | 1 hr |
| 6 | Replace render-blocking chat widgets with deferred load | −1 to −2 seconds | 1 hr |
| 7 | Move to a modern host or CDN (Vercel, Cloudflare, Netlify) | −0.5 to −2 seconds TTFB | 2–4 hr |
Fix #1 alone — replacing a 3MB JPG hero with a 200KB WebP — is usually the single highest-ROI change on a small business website. It costs nothing, takes thirty minutes, and typically pulls 3–5 seconds off the mobile LCP. Most sites I audit have at least one untouched 2–4MB hero image somewhere, and fixing it is the difference between failing and passing Core Web Vitals.
The remaining six fixes compound. After the hero, the next biggest wins are deferring third-party scripts (chat widgets, review badges, analytics tags loaded synchronously) and self-hosting fonts so the browser is not waiting on Google Fonts before rendering text. None of this requires rebuilding the site. It is configuration and asset work.
For a deeper checklist on the mobile-specific layer of this — tap targets, intrusive interstitials, and form friction — see Mobile-First Web Design: Why 65% of Web Traffic Is Mobile. And before you decide whether to fix the existing site or rebuild it from scratch, the landing page vs. full website breakdown walks through which option actually fits your business.
How to Test Your Site in 15 Minutes
A practical workflow that does not require a developer:
Step 1 — Run PageSpeed Insights. Go to pagespeed.web.dev and test your homepage and your top-traffic page. Note the mobile score, the LCP value, the INP value, and the CLS value. Anything LCP under 2.5s and a mobile score above 80 puts you in the top quartile.
Step 2 — Check Core Web Vitals in Search Console. The "Core Web Vitals" report in Google Search Console shows real-user data. URLs flagged "Poor" are costing you rankings right now. Start there.
Step 3 — Test your site on a real mid-range Android over 4G. Throttle your connection or use a hotspot. Browse like a customer: home → service → contact form → submit. Time each step. Note every spot the page felt sluggish. That is your prioritized fix list.
Step 4 — Look at the LCP element specifically. PageSpeed Insights tells you which element on your page is the LCP target. 90% of the time it is a hero image. Compress it, convert it to WebP, preload it, and re-test. That single fix usually moves the score 15–25 points.
This audit takes about fifteen minutes per page and surfaces the issues that matter for small business sites. Anything beyond this — code-level performance work, server-side rendering, image pipelines — is where you bring in a developer, and it is rarely necessary if the basics above are clean.
Speed and Local SEO: The Cabo Multiplier
Local search has gone almost entirely mobile, and the gap shows up most clearly in markets like Los Cabos and Los Angeles where tourists and locals are searching with their phone in hand and a 30-second decision window. The Google Business Profile that loads first wins the click; the site behind it that loads in under 2.5 seconds wins the booking.
Site speed compounds with everything else local SEO touches — citations, reviews, schema, Google Business Profile completeness. A perfect Google Business Profile pointing to a website that takes 9 seconds to load gives Google fewer reasons to rank you, and it gives the prospect on the other end of the click an obvious reason to leave. The full local picture, including how speed feeds into the rest of the local stack, lives in the Local SEO Los Cabos guide.
Frequently Asked Questions
How fast should a small business website load in 2026? Under 2.5 seconds for the main content on mobile (LCP), under 200 milliseconds for tap responsiveness (INP), and a layout shift score below 0.1 (CLS). Those are Google's "good" Core Web Vitals thresholds, and they map directly to the point where users start abandoning and conversions drop.
What is a good PageSpeed Insights score? On mobile, 80–90+ is excellent, 70–80 is workable, and under 60 means you are losing real money to slow load times. The score is a weighted combination of Core Web Vitals plus a few synthetic metrics, so chase the underlying field data (LCP, INP, CLS) rather than the headline number.
Why is my LCP so high?
Almost always because of a hero image. The single biggest LCP problem on small business sites is an uncompressed JPG or PNG hero file weighing 2–5MB. Convert to WebP, compress to under 250KB, and add a <link rel="preload"> hint. That usually pulls 3–5 seconds off LCP by itself.
Does page speed actually affect Google rankings? Yes, but not in isolation. Core Web Vitals are part of Google's page experience signal, which acts as a tiebreaker between pages of similar relevance. A fast page does not outrank a much more relevant slow page, but among pages of comparable quality, speed is decisive.
How much does it cost to make a small business website fast? For most small business sites, $500–$1,500 of focused performance work — image compression, font hosting, deferred JS, hosting upgrade — is enough to clear Core Web Vitals. If the site is a 10-year-old WordPress install with 40 plugins, expect closer to $2,000–$4,000 because the cleanup work dominates. A from-scratch modern build typically clears the bar without any extra optimization spend.
How long until I see ranking improvements after fixing page speed? Core Web Vitals are calculated on a 28-day rolling window of real Chrome user data, so field improvements show up in 4–6 weeks and ranking movement in 6–10 weeks. This is one of the few SEO levers with predictable, measurable cause and effect.
Does HTTPS or HTTP/2 affect page speed? HTTPS is now mandatory — Google flags non-HTTPS sites as insecure. HTTP/2 and HTTP/3 are faster than HTTP/1.1 because they multiplex requests, so check that your host supports them. Most modern hosts (Vercel, Cloudflare, Netlify) handle this automatically.
The Bottom Line
The 2026 page speed bar is 2.5 seconds on mobile for the main content, 200 milliseconds for tap responsiveness, and almost no visual jumping while the page paints. Those are not arbitrary targets — they map to the point where users start abandoning, conversions drop, and Google's page experience signal flips from positive to negative.
Most small business sites are nowhere near those numbers. Average mobile load times in retail, travel, and tech run 5–7 seconds. That gap is the opportunity. A small business site that clears 2.5 seconds on mobile will outrank and outconvert competitors stuck at 6 seconds, with no other changes to content, copy, or backlinks.
If you want a free 30-minute audit of your site's load times, Core Web Vitals scores, and the specific fixes that would move the needle most for your business, book a discovery call and I'll walk you through it page by page.